As the mythology goes, Atlas was a titan, who held the sky on his shoulders and lived with the burden of keeping the Earth and celestial spheres separate. Before the Global Burden of Disease study, health was measured in mostly death rates and causes. However, even this seemingly simple measurement is often confounded by confused causes of death, governmental agendas, and gaps in knowledge. Because of this, most statistics have an area of uncertainty. Health measurements are estimates, and disparities are often huge and unaddressed. The Global Burden of Disease grappled with these disparities, but also with the morbidity of other huge factors, such as disability, quality of life, and suggestions to improve the efficiency of resource allocation. Additionally, the study makes data easily understandable and accessible, even though these statistics are more subjective than commonly understood. Because of this, the GBD was a sort of reverse Atlas, bringing together the spheres of epidemiology and health data, and holding them together.
 One of the innovations the Global Burden of Disease study made was the addition of the DALY measurement. DALY stands for disability-adjusted life years (Smith 2015: 68). Essentially, this statistic attempts to assign a numerical value to quality of life and years “lost” to suffering. In my opinion, this should and does count as an innovation, although maybe not as amazing of one as Epic Measures makes the DALY out to be. The equation is essentially ideal age minus age of actual death minus quality adjustments lived with disability. This rates any and all disabilities as having less livable lives, as a year in a disabled persons’ life is worth less than a year in an abled persons’ life. I think this is an innovation because it pays attention to non-fatal conditions and disabilities, and gives them weight and statistical significance in a larger study. It includes disability as a pressing a significant issue, which is amazing. However, assigning a numerical value to a complicated human experience can never tell the whole story, and is in its essence, a little trivializing to those experiencing and living with these conditions (my life is only 80% as livable as your life? Ummm…). But it does speak to presence of the conditions, as well as to cultural understanding of disability. It creates biased knowledge, which is a fancy way of saying it speaks to a point of view. This is true of all knowledge though so as long as the people using these units of measurement know the limitations of an equation to sum up life, it can be helpful and illuminating.

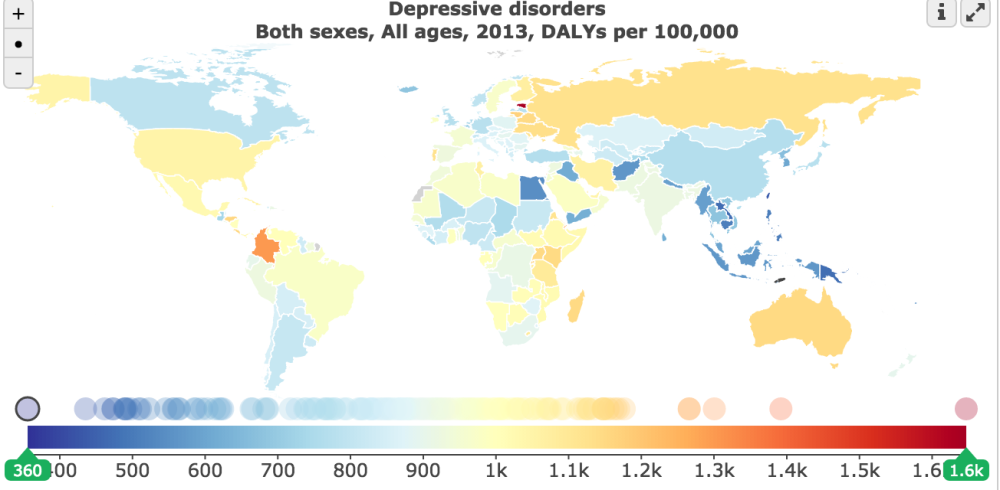
Another innovation to health data through the GBD study was the accessibility. By making the data visual and interactive, GBD has made health statistics easily accessed and usable. As anyone who has had to read through a World Bank or WHO annual report can attest, the process of finding the right statistic is time-consuming and can often be extremely confusing. With GBD, you can look up broad or very specific data with a search function that visually presents the data either in numbers, maps, charts, or graphs. Data can be comparative either country to country or condition to condition. For instance, if I want information on depression globally, I can spend 20 minutes trying to piece together WHO reports and data, or I can use GBD Compare, type in depressive disorders and instantly see the global impact. In less than three minutes, I can see the Estonia has the most DALYs per 100,000 people and Timor-Leste has the least. This kind of easy data manipulation is game changing for the global health arena. But with statistics in general, especially publicly available ones, it is easy to take them at face value and as fact, pure and simple.
All statistics are subjective to a certain extent; the same original knowledge can be interpreted different ways and lead to different results. In this way, subjective knowledge can be very useful as long as you understand its point of view. For example, let’s go back to DALYs and depression. Without the numerical data assigned to that particular condition, I would have never been able to have a global basis of comparison with which to look at depression. The knowledge is incredibly enlightening, but that doesn’t mean I don’t disagree with some of the basic assumption of the DALY, as I explained above.
While measuring the world seems like it should be simple arithmetic, it is actually immensely complicated and includes many abstractions, estimates, and holes that need to be filled. The Global Burden of Disease study holds the world of health measurement on its shoulders, an Atlas of impressively complete and useful data. This study can inform funding, programs, and global understanding. It is important to understand the biases of the knowledge being presented, and while the depth and breadth of the GBD is an incredible accomplishment, we still must ground the study in context.